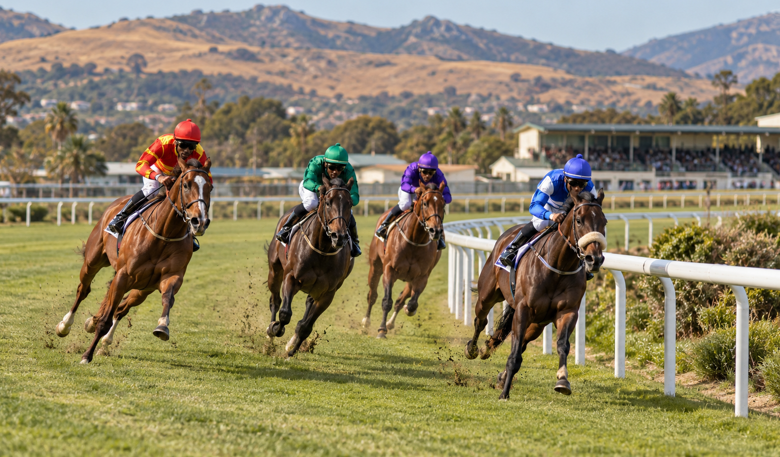
The winner reaches the line first. A second runner follows one length behind. On paper, the difference is small and easy to record.
Watch the replay and the story changes. The winner stayed near the rail. The other runner went around the bend on the outside, met traffic in the straight and only found room late.
Sectional figures help put numbers around those moments. For people following sports betting in Africa, they can add useful detail to the racecard, although a quick final split should never be mistaken for certainty about the next result.


The clock is helpful. It still needs a replay beside it.
One race time, several possible stories
The official time measures the journey from the start to the winning post. It does not show where the pace changed.
Imagine two races over the same distance. In the first, the field goes hard from the start and begins to tire before the final bend. In the second, nobody wants to lead quickly, so most of the speed arrives in the straight.
The totals could end up close. The races themselves were nothing alike.
Sectional data cuts the contest into shorter stretches. British and Irish data often uses furlongs. In other jurisdictions, the split may be every 200 metres. Modern tracking equipment records a runner’s position repeatedly during the race, allowing analysts to reconstruct its movement rather than waiting for it to pass a small number of fixed beams.
From that record, it becomes possible to spot:
- an unusually quick opening;
- a quiet middle section;
- the point where a runner began its challenge;
- a sharp loss of speed near the line;
- extra distance covered around a bend;
- ground lost while waiting for a gap.
None of these points appears in the finishing position.
A half-length can be misleading
Take two runners who reach the post almost together.
The first spent most of the race behind the leader and moved through an opening along the inside. The second was caught wide and shifted around another runner before accelerating.
Their final times will be nearly identical. Their work was not.
| Race result records | Sectional review can add |
| Position at the post | Where the move began |
| Margin between runners | Whether the margin opened early or late |
| Total race time | Slow and fast parts within that time |
| Starting stall | Route taken after the start |
| Final placing | Energy used before the straight |
There is a trap here. The quickest closer is not always the hidden star of the race. A runner near the back may finish strongly because it did little during the demanding early stages. Meanwhile, those near the lead were using energy against one another.
The split needs the race around it.
Pace is a spending decision
No runner holds top speed throughout a race. The early contest for position has a price, paid later.
A fast beginning may secure the rail or keep a horse clear of traffic. It may also leave less available when others accelerate. On another day, a slow opening creates its own problem: the race becomes a short sprint, favouring horses able to change speed quickly.
Mathematical work using thoroughbred velocity data has examined this balance through speed, bends, elevation and energy use. For a race reviewer, the practical lesson is more modest. Do not isolate the final 400 or 600 metres from what happened before it.
When reading the figures, ask:
- Was the field moving faster or slower than usual early?
- Where was this runner positioned during that pace?
- Did it accelerate once or make several moves?
- Was it still gaining at the post?
- Did it cover more ground than nearby rivals?
The answers may explain why an attractive closing split did not produce a win.
Ground conditions move the benchmark
A raw time belongs to a particular day.
Rain changes the surface. So can wind, rail placement and maintenance between meetings. Even races on the same card may not be directly comparable if the weather moves through during the afternoon.
Course shape adds another layer. An uphill finish reduces speed. A downhill approach can make the numbers look quicker. A tight bend may interrupt acceleration, while a long straight gives a runner more time to build it.
For this reason, sectional services often compare a split with a par figure for a similar course, distance and surface. That is more helpful than treating every low number as exceptional.
The par is not a verdict. If the entire field crawled early, unusually quick closing percentages are exactly what should be expected. They describe how the race unfolded, not necessarily a sudden improvement in every horse.
Where the horse ran matters too
Timing records the speed. Tracking reveals the route.
A runner travelling wide around two bends can cover extra ground without appearing dramatically slower. Another may lose places because the field accelerates while it is blocked, even though its own pace has barely changed.
Position data can draw attention to:
- distance from the leader at each split;
- width around turns;
- a move from one lane to another;
- time spent behind slowing runners;
- speed immediately before and after space became available.
This is where the video returns. Numbers may show a loss of momentum at the 400-metre point. The replay might reveal a closing gap, contact with another runner or a deliberate decision to wait.
The number locates the incident. The picture interprets it.
A late burst needs the right comparison
A final section looks quick only in relation to something else.
Compare it first with the other runners in the same race. Then look at earlier contests on the card, previous runs at a similar distance and the state of the surface.
A horse that closes quickly after an easy first half has done what the pace allowed. One producing a similar finish after racing close to a strong pace has completed a different task.
The leader deserves attention as well. Sectional discussion often concentrates on runners charging from behind, yet a front-runner that remains close to its earlier speed may.